
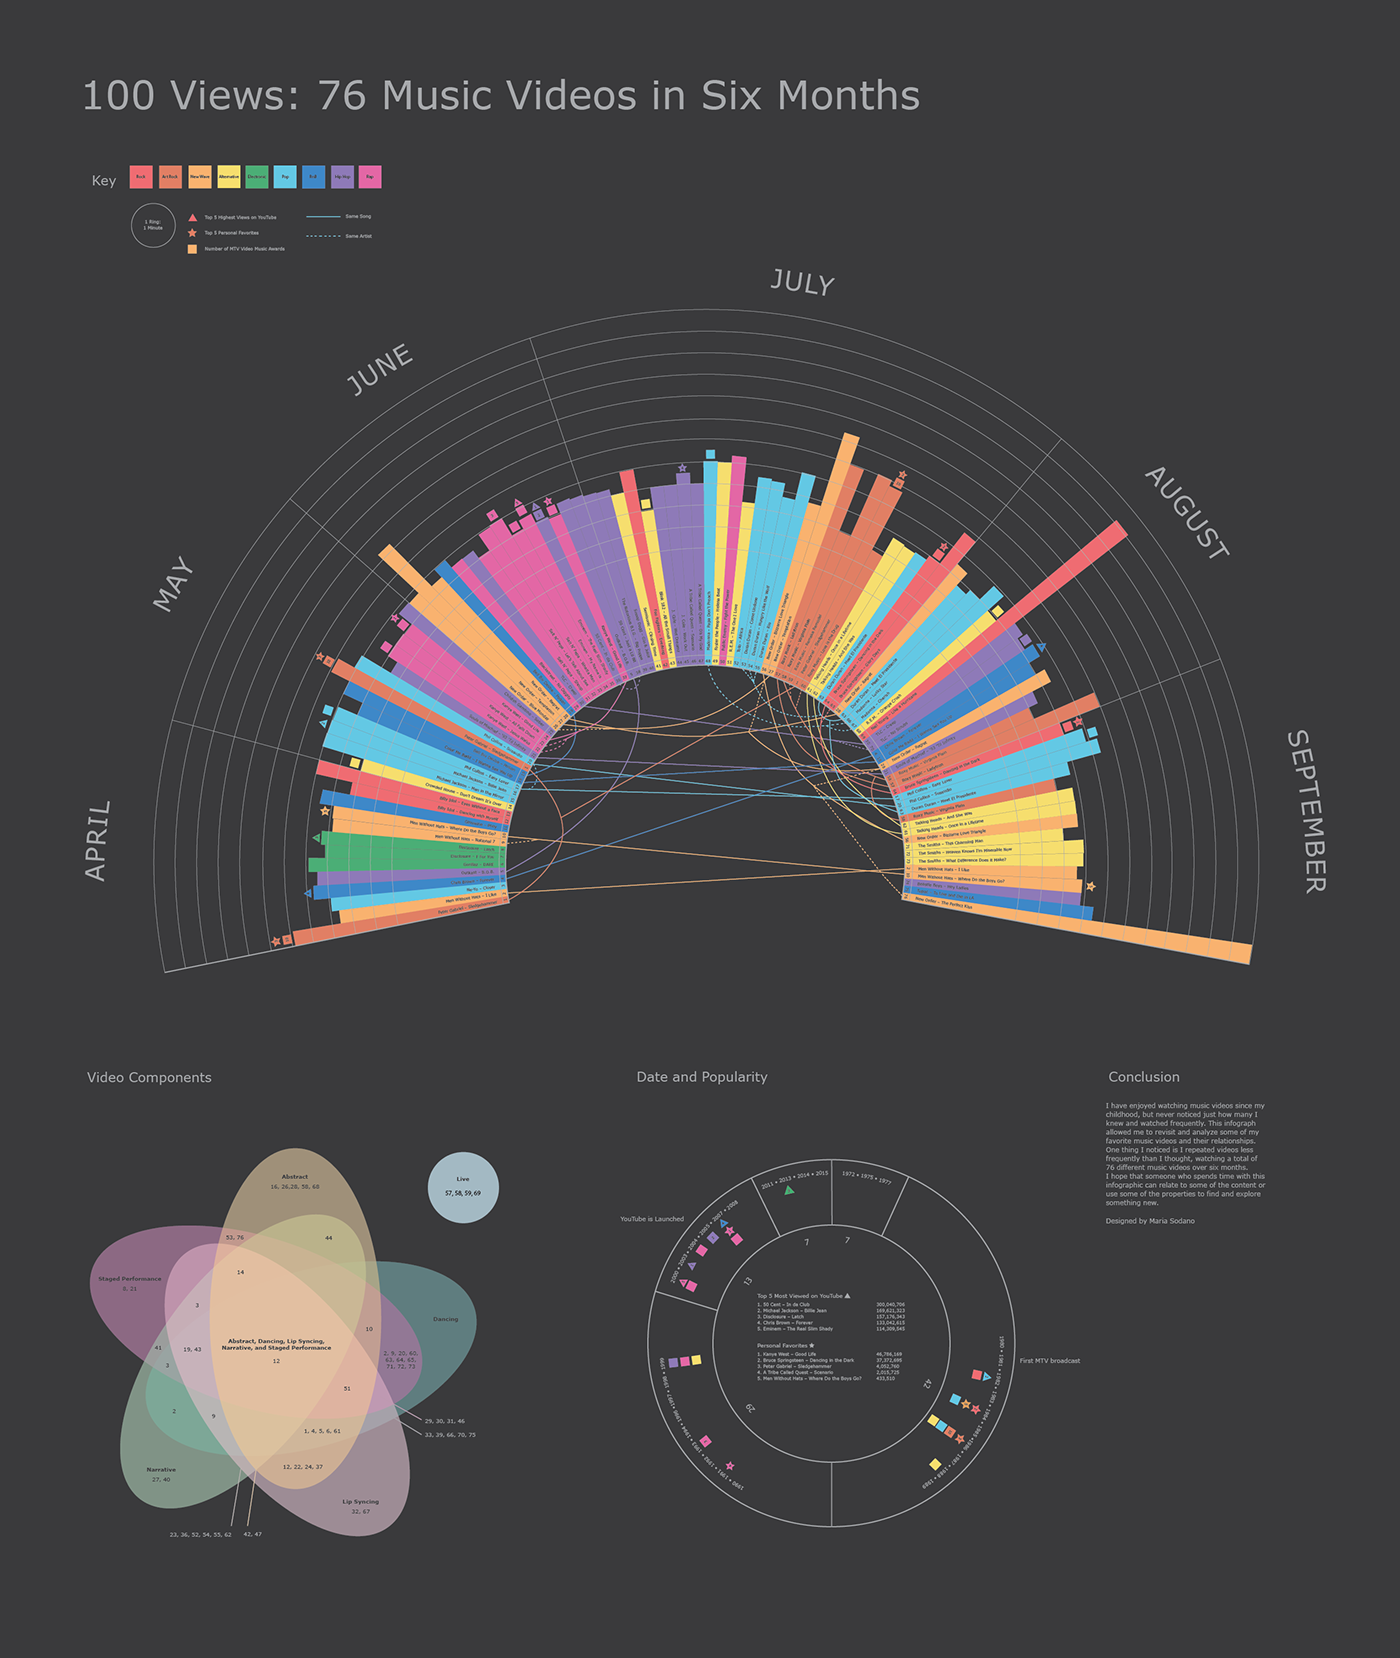
Tasked to create an infographic from 100 points of data, I chose to explore 100 music video play counts from my YouTube history. I compiled the data and organized it by 10 properties to create a three-part infographic.
Printed size 35 x 42".
View the high quality PDF
Created for Information Architecture I at Massachusetts College of Art and Design under the Instruction of Jan Kubasiewicz.
Fall 2015.
Created for Information Architecture I at Massachusetts College of Art and Design under the Instruction of Jan Kubasiewicz.
Fall 2015.


