Philip Gedarovich's profile

Data Visualization vs. Motion Graphics

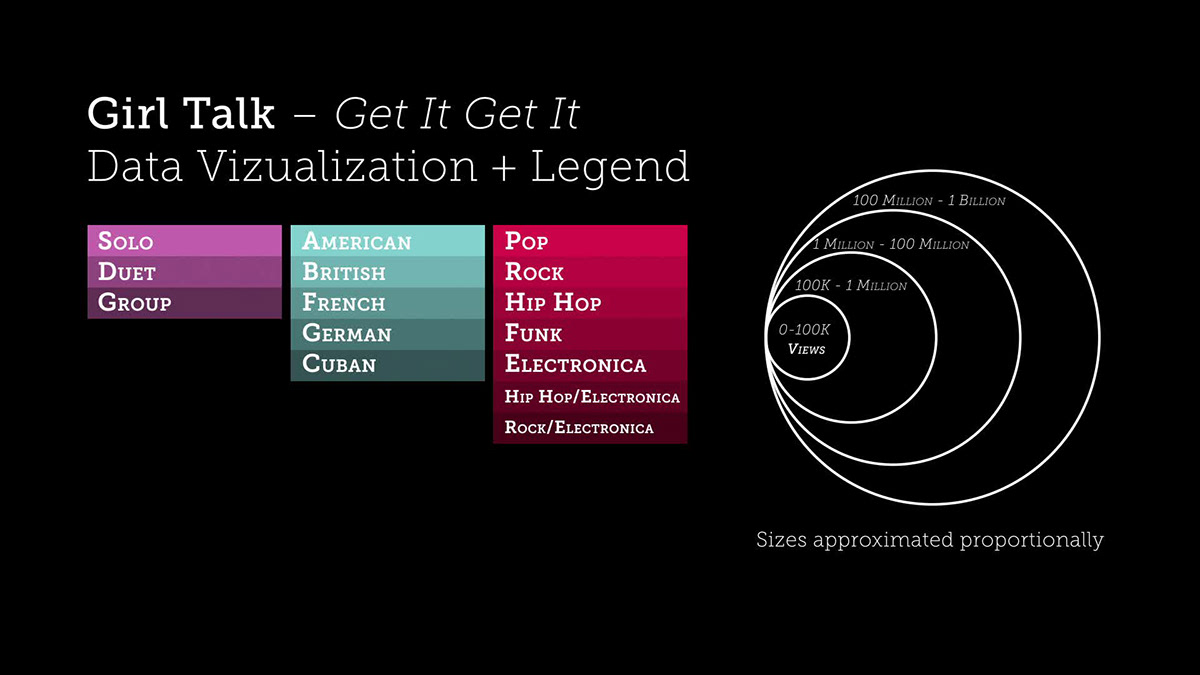
This image represents a chart or legend explaining the various data points throughout the video and how they are represented visually.
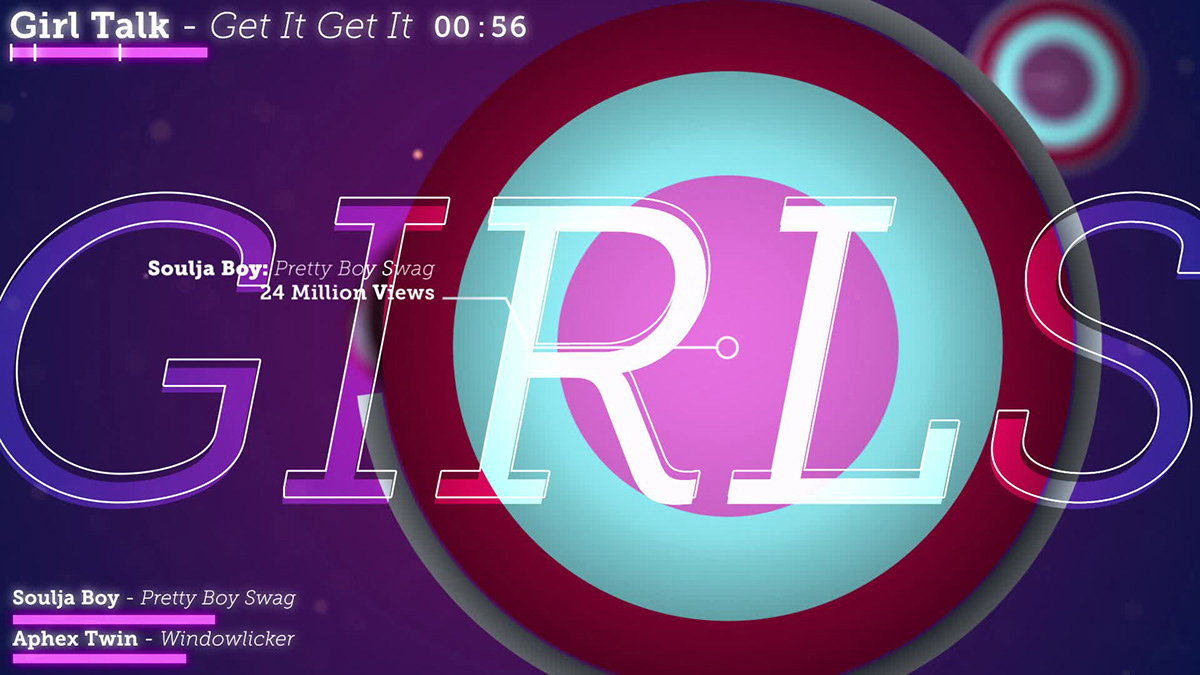
Dynamic typographic animation represents the themes echoed throughout the mashup.
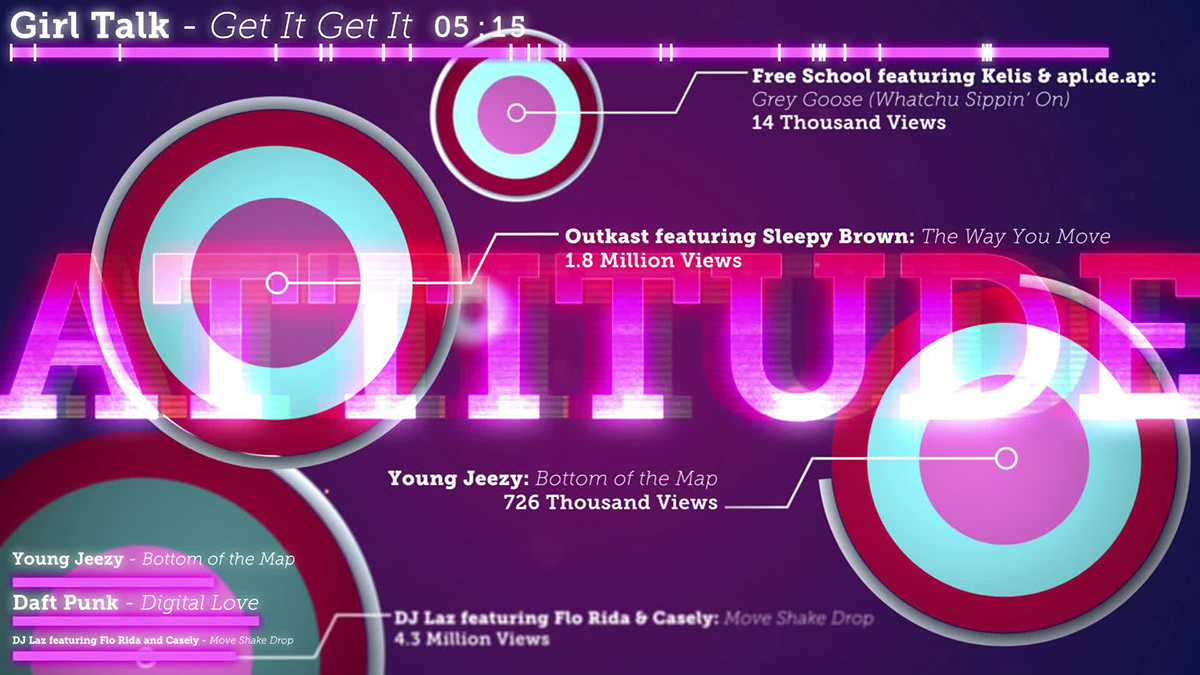
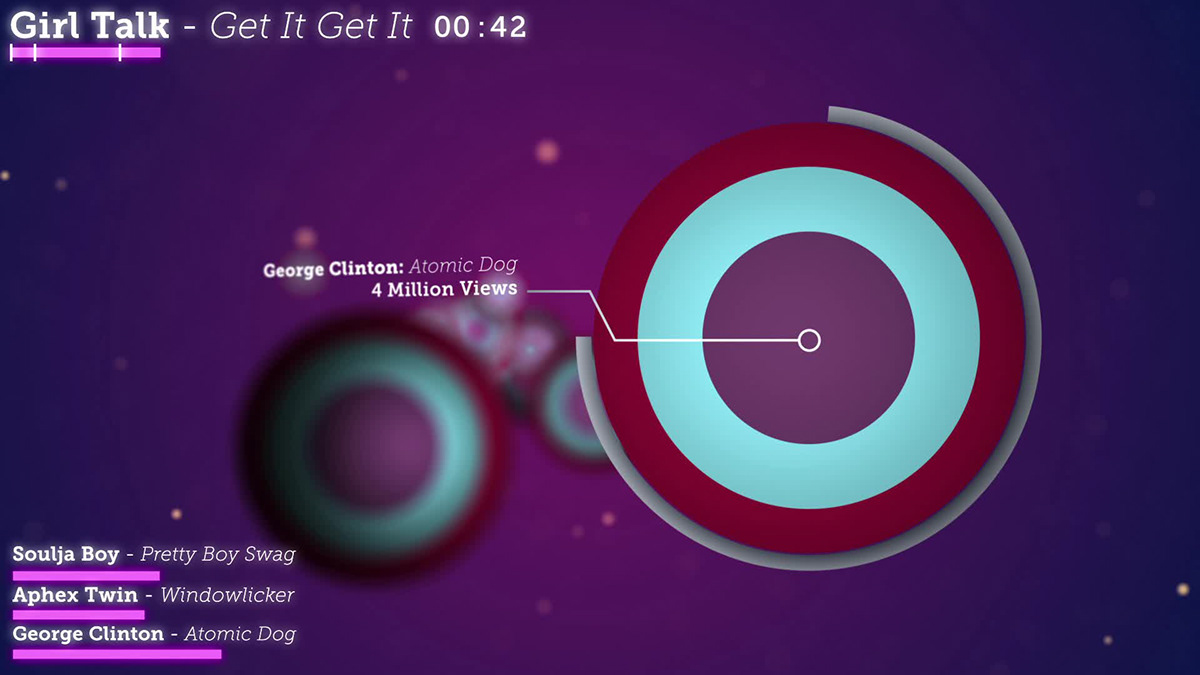
Here is the complete mashup visualized as a motion graphics based music video.
Data Visualization vs. Motion Graphics
Published:

Data Visualization vs. Motion Graphics

Data visualization meets motion graphics. The vast amount of data related to any given form of media can be somewhat overwhelming, a difficult ta Read More

Published: