


Map of Zones
Wireframing, design and data visualization for the Cosmos network explorer.
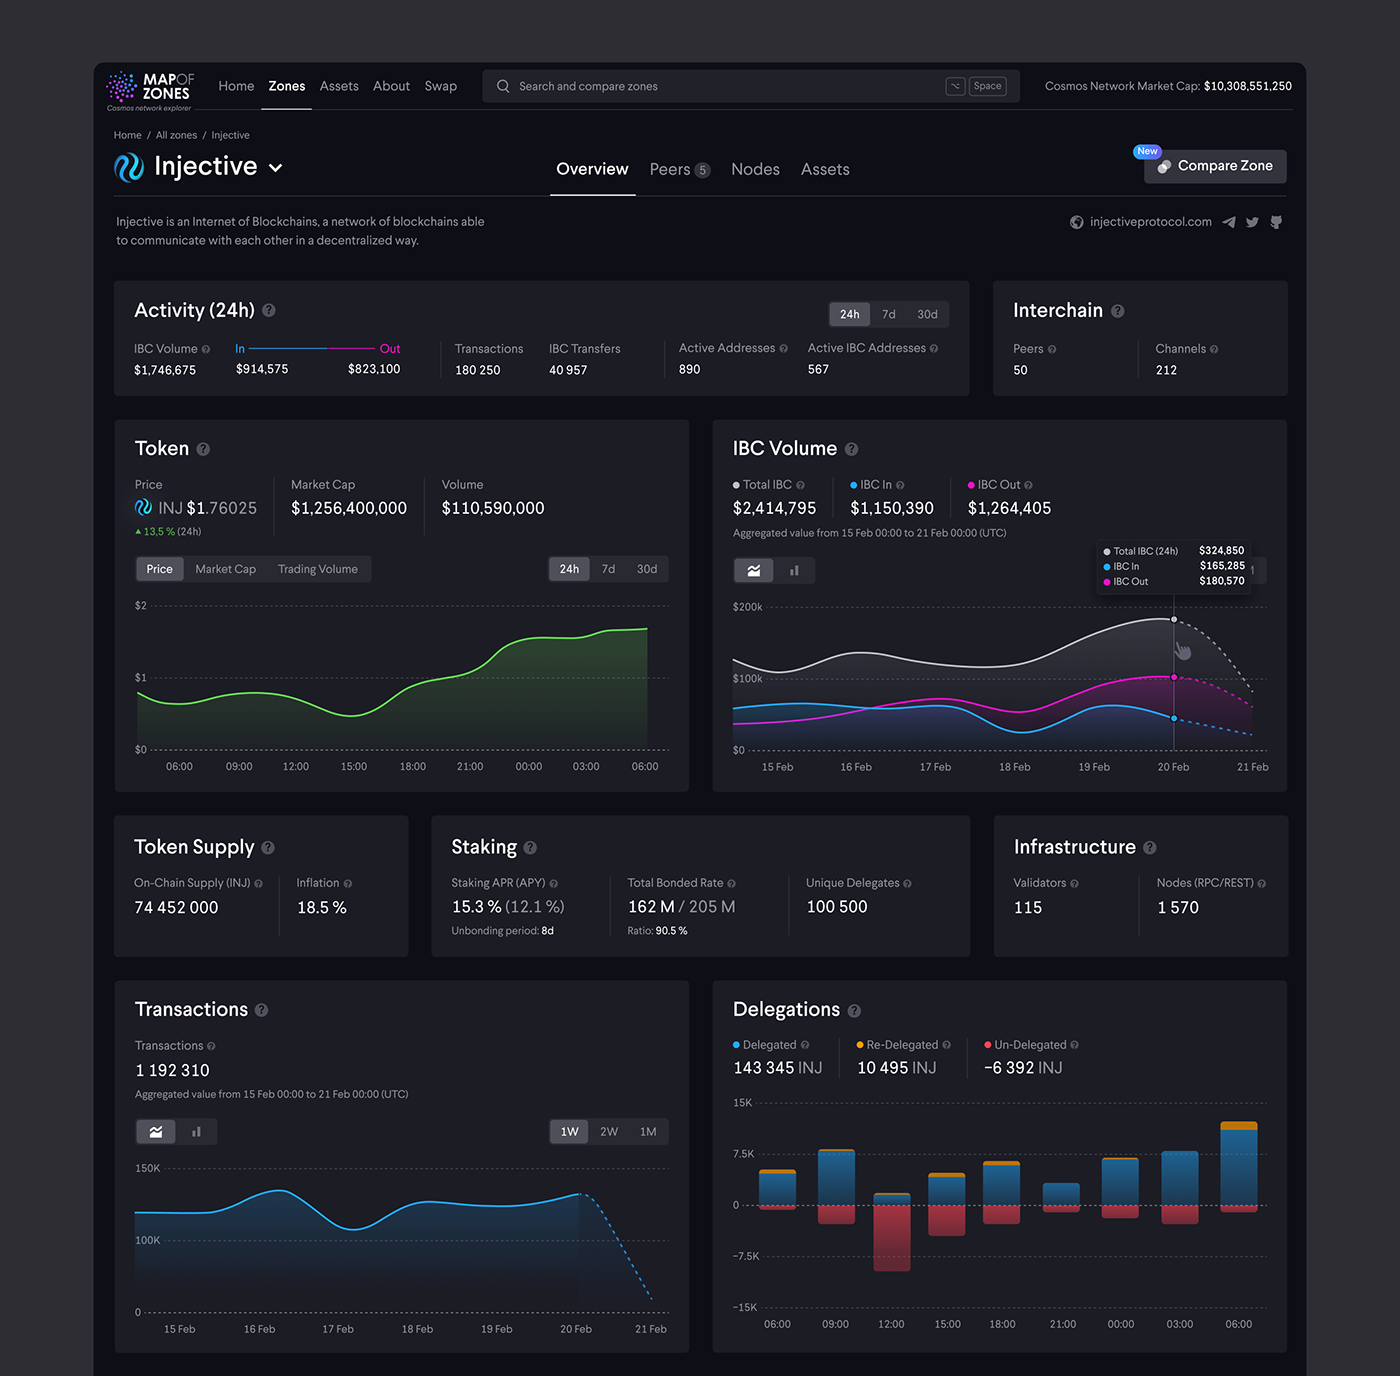
The Cosmos ecosystem consists of 60+ independent blockchains that interoperate with each other. The task was to introduce a new way of visualizing the Cosmos network universe and make the site a full-fledged analytics platform.
Design and animation: Dmitry Borovik.
d.borovik@yahoo.com
Design and animation: Dmitry Borovik.
d.borovik@yahoo.com

Three-tier composition
After several approaches, the three-layer composition was chosen as the best concept for the visualization of the map. The more powerful the blockchain, the closer it is to the center. The selected blockchain travels to the very center of the composition. In this way, the map looks clear and easy to interact with.

3D mode
The three-dimensional mode is an additional elegant way to display the interconnections of chains on the map, which enhances the sense of immersion in the Cosmos universe.


Compare mode
Another crucial feature of the platform is the option to compare various zone metrics. The user can add zones to the comparison from the blockchain list or directly from the search on the site.


