December, 2022
data pins
portrait of a team
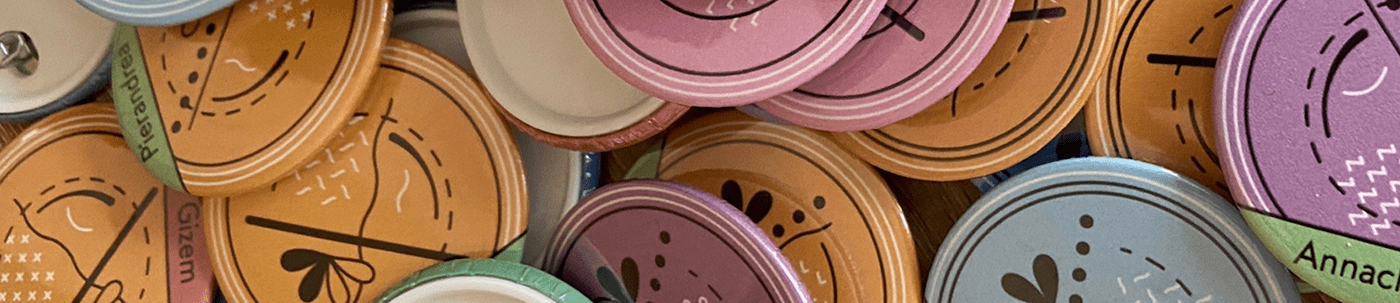
For this year's Christmas event at work, we designed and produced data-driven pins for each member of our team – a Data Science team of 65 people, consisting of data scientists, data engineers, and business translators based in Italy and Turkey.
To first get the data, we created a survey of 13 questions to be submitted to all our colleagues. We thought about a set of questions that could describe the background and role in the company of each of us, along with other work-related and personal features. From the data, we then designed a visual system that turned each answer into a specific symbol, with its own shape, color, or position. The unique combination of all the answers defines every person in the team and his/her personal pin. Finally, pins were delivered accompanied by a visual legend to decode each symbol.


This project gave me the chance to follow the development of a product from its ideation to the final realization for the first time. We worked in a team of 3 people (Riccardo, Sara, and I) for about one month and a half, using tools such as Excel and Adobe Illustrator. Below, a summary of the process we followed.
Product development workflow:
1 brainstorming and ideation
2 survey definition and data collection
3 sketches
4 design and prototyping
5 pins production and packaging
data collection


sketches


design


Background features: Riccardo, Sara and I are all data scientists based in Italy and born between 1990 and 2000. Riccardo studied physics, Sara linguistics and I studied statistics.
Work-related features: Riccardo and Sara do not have working unread emails, while I have some. We all book our working hours in the system on a weekly basis. Riccardo usually brings his lunch from home, Sara takes it at the supermarket and I usually go to some restaurant.
Personal features: Sara and I would like to travel in the future and we do not continue a book we don't like, Riccardo would travel in the past and would rather push himself to finish a book he doesn't like. Riccardo and I would fight against 10 duck-sized horses, while Sara against one horse-sized duck. Sara and I would choose telepathy as super power, and we both prefer the dog in the picture B, Riccardo would like to be able to teleport himself and chooses first picture A then B.
packaging and delivering


references
1 Dear Data, by Giorgia Lupi and Stefanie Posavec
2 Observe, Collect, Draw! A Visual Journal, Discover the Patterns in Your Everyday Life, by Giorgia Lupi and Stefanie Posavec
3 Data Portraits at TED, by Giorgia Lupi


thanks for watching!

