
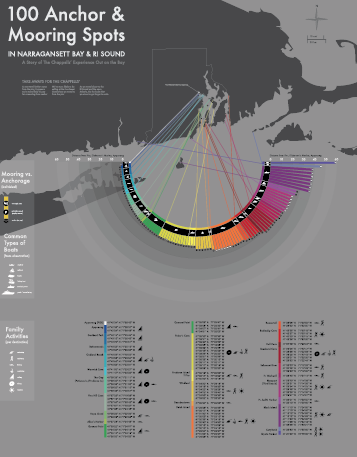
Information architecture based assignment to organize a complex set of data into a static print piece. Here I mapped out 100 anchor and mooring coordinates in Rhode Island that my family particularly enjoys going boating to in the summer season. I organized the metadata in 6 major categories: Coordinates (latitude/
longitude), Neighborhood (represented by color), Distance from Home Pier (in nautical miles), Mooring vs. Anchorage (price for mooring included), Common Types of Boats (per neighborhood), and Common Family Activites.
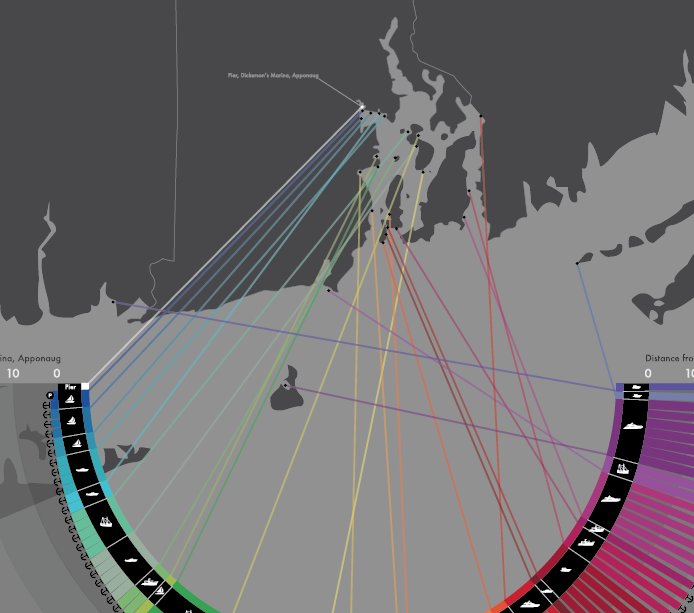
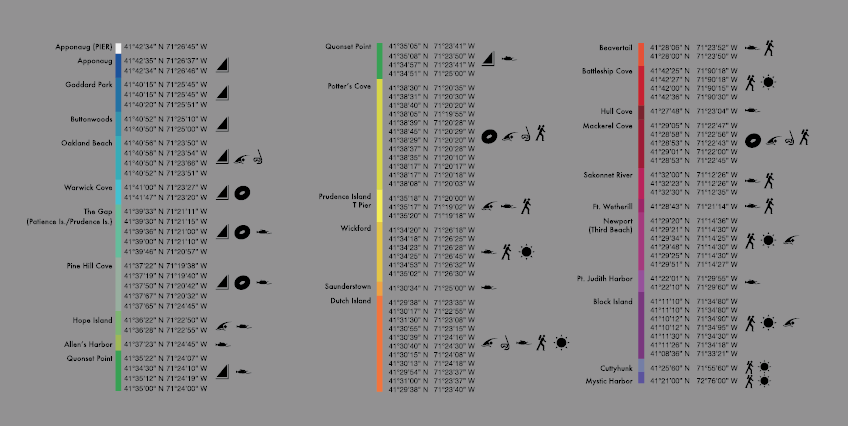
Close ups


Student work for Massachusetts College of Art & Design.


